Archive for the ‘Programming’ Category
SWIG and Complex C structures
I had to use SWIG to access a kernel module’s chardev interface through python and found SWIG examples are not enough, so adding my own.
Lets take the following example header file.
I will explain how to access all the members in complex_struct_t from python.
Also extend these structures so that python code would look little better.
[codegroup]
[c tab=”header”]
/* test.h */
#ifndef _TEST_STRUCT_H
#define _TEST_STRUCT_H
/* a simple structure – no problem with SWIG */
typedef struct simple_struct {
int int_var;
long long_var;
float float_var;
} simple_struct_t;
typedef struct tlv_base {
int type;
int length;
unsigned char value[];
} tlv_base_t;
typedef struct tlv_type1 {
tlv_base_t base;
int stat;
int info;
long something;
} tlv_type1_t;
/* relatively complex C structure. */
typedef struct complex_struct {
char string[10]; //SWIG considers this as null terminated string
unsigned char bytes[10]; //SWIG wont considers this as string
simple_struct_t embedded;
int pointer_array_count;
simple_struct_t *pointer_array; //SWIG supports only accessing first element.
tlv_base_t tlv; //How do cast this to derived_struct_1 ?
} complex_struct_t;
complex_struct_t * alloc_complex_struct(int array_count);
void free_complex_struct(complex_struct_t *cs);
void print_complex_struct(complex_struct_t *cs);
#endif
[/c]
[c tab=’source’]
/* test.c */
#include
#include
#include “test.h”
complex_struct_t *
alloc_complex_struct(int array_count)
{
complex_struct_t *result;
size_t size;
result = (complex_struct_t *)malloc(sizeof(complex_struct_t) + sizeof(tlv_type1_t));
if (result == NULL){
return NULL;
}
result->tlv.type = 1;
result->tlv.length = sizeof(tlv_type1_t);
size = sizeof(simple_struct_t) * array_count;
result->pointer_array = (simple_struct_t *)malloc(size);
if (result->pointer_array == NULL) {
free(result);
return NULL;
}
memset(result->pointer_array, 0, size);
result->pointer_array_count = array_count;
return result;
}
void
free_complex_struct(complex_struct_t *cs)
{
free(cs->pointer_array);
free(cs);
}
static inline void
print_simple_struct(simple_struct_t *ss)
{
printf(“int %d long %ld float %f\n”, ss->int_var, ss->long_var, ss->float_var);
}
void
print_complex_struct(complex_struct_t *cs)
{
int i;
printf(“String = %s\n”, cs->string);
printf(“Embedded : “);
print_simple_struct(&cs->embedded);
printf(“External : \n”);
for (i=0; i
printf(“%d) “, i + 1);
print_simple_struct(&cs->pointer_array[i]);
}
}
[/c]
[raw tab=’interface’]
// test_swig.i
%module test_struct
%{
#include “../test.h”
%}
%include “test.h”
[/raw]
[shell tab=’commands’]
# Commands to make the shared library
$ mkdir -p _build
$ gcc -I /usr/include/python2.7/ -fPIC -c -o _build/test.o test.c
$ swig -python -outdir _build -o _build/test_swig_wrap.c test_swig.i
$ gcc -I /usr/include/python2.7/ -fPIC -c -o _build/test_swig_wrap.o _build/test_swig_wrap.c
$ ld -shared _build/test.o _build/test_swig_wrap.o -o _build/_test_struct.so
$ rm _build/test_swig_wrap.c
[/shell]
[raw tab=’makefile’]
#Makefile
BLD_DIRECTORY = _build
SWIG_SRCS = test_swig.i
C_SRCS = test.c
CFLAGS = -I /usr/include/python2.7/ -fPIC -c -Wall
OBJS = $(patsubst %.c, $(BLD_DIRECTORY)/%.o, $(C_SRCS)) \
$(patsubst %.i, $(BLD_DIRECTORY)/%_wrap.o, $(SWIG_SRCS))
$(BLD_DIRECTORY)/%.o: %.c %.h
gcc $(CFLAGS) -o $@ $<
$(BLD_DIRECTORY)/%.o: $(BLD_DIRECTORY)/%.c
gcc $(CFLAGS) -o $@ $<
$(BLD_DIRECTORY)/%_wrap.c: %.i
swig -python -outdir $(BLD_DIRECTORY) -o $@ $<
cp $@ $@.bak
$(BLD_DIRECTORY):
mkdir -p $(BLD_DIRECTORY)
clean:
rm -rf $(BLD_DIRECTORY)
all: $(BLD_DIRECTORY) $(OBJS) $(C_SRCS) $(SWIG_SRCS)
ld -shared $(OBJS) -o $(BLD_DIRECTORY)/_test_struct.so
.PHONY: all clean
.DEFAULT_GOAL := all
[/raw]
[/codegroup]
With this simple interface file, SWIG would be able to create a _test_struct.so and test_struct.py which is perfect for most cases.
[raw tab=’interface’]
%module test_struct
%{
#include “../test.h”
%}
%include “test.h”
[/raw]
[python]
import test_struct as ts
cs = ts.alloc_complex_struct(1)
cs.string = “Hello”
cs.embedded.int_var = 9
cs.embedded.long_var = 10
cs.embedded.float_var = 11.23
ts.print_complex_struct(cs)
ts.free_complex_struct(cs)
[/python]
This shows SWIG’s ability to convert C string to python string and vice versa.
Similarly accessing primitive structure members is very easy.
Here is the output of the program when ran from _build directory.
[raw]
String = Hello
Embedded : int 9 long 10 float 11.230000
Pointer Array :
1) int 0 long 0 float 0.000000
[/raw]
It also shows how to call function call into C library. If you have noticed this program looks more like a C program rather than a python program – mainly because it manages the memory allocation/free. Python can informed that [c] alloc_complex_struct() [/c] returns a new object and it is the responsibility of the caller to free it by using the SWIG typemap [python] newobject [/python]. Now python garbage collector will free the object when there is no reference. But python does not know how to free the object(complex_struct_t) – this can be done by using [python]newfree[/python] typemap.
By adding the following to the test_swig.i, we can avoid calling free_complex_struct() in python program.
[c]
%typemap(newobject) alloc_complex_struct;
%typemap(newfree) complex_struct_t * {
free_complex_struct($1);
}
[/c]
Lets modify the program a little bit and access the pointer_array elements.
[python]
import test_struct as ts
cs = ts.alloc_complex_struct(5)
print ‘Pointer array count ‘, cs.pointer_array_count
print cs.pointer_array[0]
ts.free_complex_struct(cs)
[/python]
This will fail with the following error:
[raw]
Pointer array count 5
Traceback (most recent call last):
File “./test.py”, line 4, in
print cs.pointer_array[0]
TypeError: ‘simple_struct_t’ object does not support indexing
[/raw]
The reason is SWIG does not really know [c]simple_struct_t *pointer_array;[/c] actually points to an array of [c]simple_struct_t[/c]. In other words SWIG safely assumes it points to a single entry. If pointer_array was “array of simple_struct_t pointers” then carrays.i macro would have been helped. But pointer_array is actually “pointer to array of simple_struct_t” so carrays.i won’t help.
The easiest way is extending complex_struct_t and add a new member(kind of) function to it.
[c]
%extend complex_struct_t{
simple_struct_t *get_array_element(int i) {
return &$self->pointer_array[i];
}
}
[/c]
This way cs.get_array_element(4) will return 4th element in the array.
Similarly tlv elements can be accessed also – but this time I decided to override indexing operator([]).
[c]
%extend complex_struct_t{
unsigned char __getitem__(int i) {
return $self->tlv[i];
}
}
[/c]
However this is not useful since python cant cast from [c](struct tlv_base *)[/c] to [c]struct tlv_type1 *[/c]. To cast, a C function can be coded or SWIG’s cpointer.i can be used.
Here is the full test_swig.i
[c]
%module test_struct
%{
#include “../test.h”
%}
%include “test.h”
%extend complex_struct{
simple_struct_t *get_array_element(int i) {
return &$self->pointer_array[i];
}
}
%typemap(newobject) alloc_complex_struct;
%typemap(newfree) complex_struct_t * {
free_complex_struct($1);
}
%include
%pointer_cast(tlv_base_t *, tlv_type1_t *, cast_to_tlv_type1);
[/c]
And test code:
[python]
import test_struct as ts
cs = ts.alloc_complex_struct(5)
cs.string = ‘Hello’
print ‘Pointer array count ‘, cs.pointer_array_count
for i in range(cs.pointer_array_count):
simple_struct = cs.get_array_element(i)
simple_struct.int_var = i * 10
simple_struct.long_var = i * 20
simple_struct.float_var = i * 3.3
ts.print_complex_struct(cs)
tlv = ts.cast_to_tlv_type1(cs.tlv)
print tlv.stat, tlv.info, tlv.something
[/python]
Plot your data using gnuplot
System statistics are hard interpolate since usually they are collected in large quantities and sometimes represents large numbers. Recently I was doing a prototype and wanted to measure how much damage it would to the main project (in terms of performance); so used performance counter feature in the processor to measure some events(cache miss, memory read etc) with and without my code change. But after looking at the numbers I realized it is difficult to analyze such a data. Because each number is 8 digit and I had 16 columns(16 cpu) and 100 rows of data(100 seconds of run). So I decided to use some graph so that it would be easy to understand the data.
Googled for a GNU graph tool and found gnu plot – this blog is to show how good it is and how easy it is to use. Consider using it if you have lot of numbers. For this post I took some sample data from my ubuntu machine while running stress command.
[codegroup]
[shell tab=’output’]
cat stat.txt
procs ———–memory———- —swap– —–io—- -system– —-cpu—-
r b swpd free buff cache si so bi bo in cs us sy id wa
0 0 251124 1827388 4720 32704 6 34 19 38 42 74 1 0 98 1
0 0 251124 1827388 4720 32708 0 0 0 0 104 71 0 0 100 0
13 3 251108 1349912 4728 322540 4 0 4 20 683 1789 42 12 47 0
11 3 251008 1382620 4728 322520 180 0 180 0 1604 1233 89 12 0 0
11 3 251008 1432052 4728 322520 0 0 0 0 1361 1237 90 10 0 0
11 3 251008 1298352 4728 322668 0 0 0 0 1392 1275 90 10 0 0
2 3 251008 1512576 4728 323524 0 0 0 0 20077 14827 59 16 13 12
0 0 251008 1826388 4728 32756 0 0 0 0 45069 25566 0 4 25 71
0 0 251008 1826444 4728 32708 0 0 0 0 59 46 0 0 100 0
…
[/shell]
[shell tab=’stress’]
stress –cpu 8 –io 4 –vm 2 –vm-bytes 128M –hdd 2 –timeout 200s
[/shell]
[shell tab=’vmstat’]
sudo vmstat -n 1 200 > stat.txt
[/shell]
[/codegroup]
The following example shows how to create line graph for us, sy columns in the above against time(seconds).
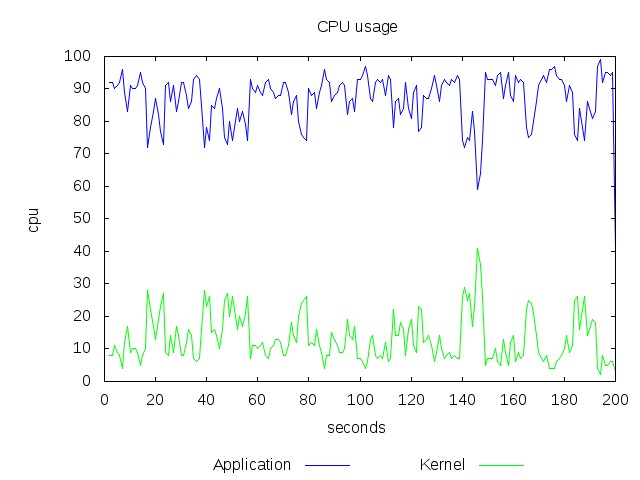
This graph might not be impressive because it deals with only numbers ranging from 0-100 and the numbers are very steady. Consider a range 0-99999999 and the numbers are fluctuating too much then it will be to graph. The above graph was created by running “gnuplot” with following commands
[shell]
set title ‘CPU usage’
#set terminal svg butt enhanced dynamic
set terminal jpeg
set output ‘output.jpg’
set xlabel ‘seconds’
#set logscale y
set ylabel ‘cpu’
set key below
plot \
“stat.txt” using :13 title ‘Application’ with lines lc rgb ‘blue’, \
“stat.txt” using :14 title ‘Kernel’ with lines lc rgb ‘green’
[/shell]
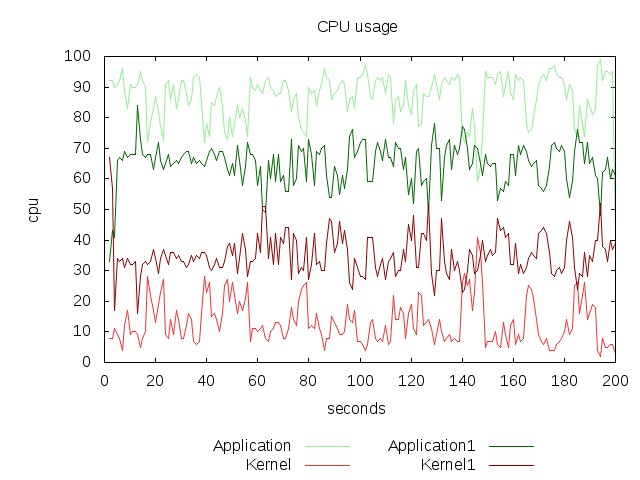
You can also intermix two or more data files. The following example shows how to graph two different samples collected during different time period.
[shell]
set title ‘CPU usage’
#set terminal svg butt enhanced dynamic
set terminal jpeg
set output ‘output.jpg’
set xlabel ‘seconds’
#set logscale y
set ylabel ‘cpu’
set key below
plot \
“stat.txt” using :13 title ‘Application’ with lines lc rgb ‘light-green’, \
“stat.txt” using :14 title ‘Kernel’ with lines lc rgb ‘light-red’, \
“stat1.txt” using :13 title ‘Application1’ with lines lc rgb ‘dark-green’, \
“stat1.txt” using :14 title ‘Kernel1’ with lines lc rgb ‘dark-red’
[/shell]
The stat1.txt file is generated by running vmstat while the system was stressed by the following command
[shell]stress –cpu 4 –io 2 –vm 4 –vm-bytes 1M –hdd 2 –hdd-bytes 4096 –timeout 200s[/shell]
The nice thing about gnuplot is it will skip the row(line) in the data file if it cant recognize the columns. And also it supports svg and pdf outputs. See what all gnuplot can do at the official demo page.
Call Trace without modifying the source
While investigating about gcc flag “-fprofile-arcs”, I came to know about a new(to me) gcc flag and this blog entry is about it. For any large C project it is hard to learn/find call graph through code walk. From C prospective unless otherwise you put a printf in each function entry/exit it is hard to find the call trace.
GCC and ICC has a wonderful option “-finstrument-functions” to solve this. This option instructs the compiler to emit instructions to call a external function on each function’s entry/exit. Defining these two functions like the following and adding the above option -finstrument-function to your makefile will do the magic.
[c]
void noinstrument __cyg_profile_func_enter(void *this_fn, void *call_site)
{
printf(“%p called from %p\n”, this_fn, call_site);
}
void noinstrument __cyg_profile_func_exit(void *this_fn, void *call_site)
{
printf(“%p returns\n”, this_fn);
}
[/c]
Of course, you can do anything in these functions, for simplicity sake I just defined them as printfs.
GCC debugging switches
While compiling a FreeBSD kernel I encountered the following error message from GNU assembler
[shell]
Error: suffix or operands invalid for ‘mov’
[/shell]
I was not sure whether the error is because of my changes are not. But still I have to debug the problem and solve it, so I decided to find what is wrong with the mov instruction. But since gcc created a temporary file and invoked as to assemble it, I couldn’t find the temp file anymore.
Googled and find the following gcc options to find what gcc does.
gcc –v is verbose mode, which prints all the action/scripts gcc is doing.
gcc -### similar to –v but wont execute any commands.
gcc –save-temps saves all the temporary files generated by the gcc. Useful if you want to see the assembly output passed to gnu assembler.
gcc –E Just preprocess the c file.
gcc –S generate assembly file.
With gcc –v –save-temps, I got the temporary assembler file used by assembler. Since reading machine generated assembly file is difficult, I tried to find the C source code corresponding to the error. From nearest .file assembler directive I found the C file name and from the .loc directive I found the line number. And the following was the inline assembly in the C file.
[c]__asm __volatile(“movl %%ss,%0″ : “=rm” (sel));[/c]
Was surprised what is wrong with this and why my assembler giving error. Googled again and found this link – http://kerneltrap.org/node/5785. It seems newer gnu assembler(>=2.16) wont support long read/write operations(mov) on segment registers(ds,ss…). So changed the above source to movw %%ss, %o and it compiled perfectly. 🙂
Unreferenced symbols – EXPORT_SYMBOL
I wrote ACPI driver for Ace and try to load it into kernel. It was failing with the error message symbol not found.
The log file content says AcpiGetName was not found.
[shell]
$ cat log.txt
Driver for id acpi : acpi.sys
../src/kernel/pm/elf.c:343:FindElfSymbolByName(): Symbol not found AcpiGetName(c01a2148:1869) string table c01aa619
[shell]
After exploring the Acpi-CA source code and Ace kernel code, I couldn’t figure out why the symbol is missing. Then I tried to dump the symbol table for Acpi library and kernel.sys.
[shell]
$ nm build/default/src/kernel/libacpi.a | grep GetName
U AcpiExGetNameString
000001e3 T AcpiExGetNameString
000001b7 T AcpiPsGetName
000000f4 T AcpiGetName
$ nm build/default/src/kernel/kernel.sys | grep GetName
c0135163 T AcpiExGetNameString
c0137bfb T AcpiPsGetName
[/shell]
It is obvious during kernel link process some how the linker is losing AcpiGetName. Within few seconds I realized that the linker is doing optimization on the output to remove unreferenced sections. So I googled for how to avoid this and found –no-gc-sections is the ld option to do it. However even after giving this option to linker to was removing the unreferenced symbols; I kept on trying to find a solution for making the linker to include unreferenced symbols in the output… I didn’t find the solution.
Then I started thinking how linux kernel is avoiding this problem and I it flashed seeing EXPORT_SYMBOL kind of macro in some source. So I googled for it and got the answer – use the symbol in storage, so that it will be referenced, so that linker will include it in the output.
[c]
struct kernel_symbol
{
unsigned long symbol;
char * name;
};
#ifndef MODULE_SYMBOL_PREFIX
#define MODULE_SYMBOL_PREFIX “”
#endif
#define __EXPORT_SYMBOL(sym, sec) \
static const char __kstrtab_##sym[] \
__attribute__((section(“__ksymtab_strings”))) \
= MODULE_SYMBOL_PREFIX#sym; \
static const struct kernel_symbol __ksymtab_##sym \
__attribute__((section(“__ksymtab” sec), unused)) \
= { (unsigned long)&sym, __kstrtab_##sym }
#define EXPORT_SYMBOL(sym) \
__EXPORT_SYMBOL(sym, “”)
[/c]
Source code browsing tool
In UNIX environment there is the famous “cscope”, to browse the source code and make changes. Using cscope it is easy to browse/edit the source code, cross reference all the functions calling a function, including a file etc.
In windows, I was using notepad++’s find files options browse C source code. Today I decided to find an open source full fledged source navigator for windows.
I started with notepad++ plugin – “Function List”. But it is just not enough for a project source browsing. Google searches gave me cscope port of windows(http://cscope.sourceforge.net/). However I wanted more – the GUI. With few more searches I found Source Navigator – http://sourcenav.sourceforge.net/
Soucrce Navigator is very useful, I just added my project and it give me full list of symbols. Editing a function is just clicking it. Since I am using notepad++ for editing anything, I changed the editor preference to notepad++. To do go to Source Navigator->File menu->Project Preference->Edit-> External editor and give the following line
“C:\Program Files\Notepad++\notepad++.exe” -n%l
Now I can easily browse the source code in Source Navigator and edit it in Notepad++ with few keystrokes.
Bitfield inside a Union
When coding Ace physical memory manager, I came to a situation where I have to use lot of bit operations on a integer variable. The code looked little ugly because of the explicit bit operations(left shift
[c]
typedef struct struct_x
{
union
{
int all;
int x:1,y:1,z:30,
};
};
[/c]
The above code wasn’t working; debugging further I found that the values for bitfields are not calculated correctly.
After some digging I found that, the bitfield hint is ignored by the compiler since it is directly under union. So the compiler treated the fields x,y,z as separate integer instead of considering as one.
I modified the code to pack the bitfields inside a structure and it worked correctly.
[c]
typedef struct struct_x
{
union
{
int all;
struct
{
int x:1, y:1, z:30,
}_;
};
};
[/c]
And yes, just an underscore(_) is a valid identifier.
Configuring Cygwin to use proxy server
Today I was trying to setup ACPI-CA source tree in my computer using the following command
git clone http://www.acpica.org/repos/acpica.git
but it gave me error when connecting to the site. I knew it was problem with my cygwin network settings. Since I have a proxy server in between, connections internet was failing.
Googleing internet for how to configure cygwin to use proxy didn’t yield any result. Two of my friends with Linux knowledge advised me to set an environment variable (http_proxy) to connect. After exporting it, everything worked fine.
export http_proxy=http://username:password@host:port/
Leading underscores in C
C compilers were prepending an underscore to all the symbols (function, variable names). I read from somewhere this is to avoid name collision with other language libraries. This convention was started with UNIX. When UNIX was written in C to use the existing assembly libraries, C symbols were added with a leading underscore by compilers and linkers.
Currently there is no need for this unless otherwise if you want to use old library. So most of the new C compilers are not adding leading underscores; however it also depends on the platform and object file. For example, Linux a.out GCC does such prepending, while Linux ELF GCC does not.
To explicitly tell the GCC compiler to not to use leading underscore you can use –fno-leading-underscore option.
Note: FORTRAN was adding both leading and trailing underscores to avoid name collision to avoid naming collision with C.