Archive for the ‘C’ Category
SWIG and Complex C structures
I had to use SWIG to access a kernel module’s chardev interface through python and found SWIG examples are not enough, so adding my own.
Lets take the following example header file.
I will explain how to access all the members in complex_struct_t from python.
Also extend these structures so that python code would look little better.
[codegroup]
[c tab=”header”]
/* test.h */
#ifndef _TEST_STRUCT_H
#define _TEST_STRUCT_H
/* a simple structure – no problem with SWIG */
typedef struct simple_struct {
int int_var;
long long_var;
float float_var;
} simple_struct_t;
typedef struct tlv_base {
int type;
int length;
unsigned char value[];
} tlv_base_t;
typedef struct tlv_type1 {
tlv_base_t base;
int stat;
int info;
long something;
} tlv_type1_t;
/* relatively complex C structure. */
typedef struct complex_struct {
char string[10]; //SWIG considers this as null terminated string
unsigned char bytes[10]; //SWIG wont considers this as string
simple_struct_t embedded;
int pointer_array_count;
simple_struct_t *pointer_array; //SWIG supports only accessing first element.
tlv_base_t tlv; //How do cast this to derived_struct_1 ?
} complex_struct_t;
complex_struct_t * alloc_complex_struct(int array_count);
void free_complex_struct(complex_struct_t *cs);
void print_complex_struct(complex_struct_t *cs);
#endif
[/c]
[c tab=’source’]
/* test.c */
#include
#include
#include “test.h”
complex_struct_t *
alloc_complex_struct(int array_count)
{
complex_struct_t *result;
size_t size;
result = (complex_struct_t *)malloc(sizeof(complex_struct_t) + sizeof(tlv_type1_t));
if (result == NULL){
return NULL;
}
result->tlv.type = 1;
result->tlv.length = sizeof(tlv_type1_t);
size = sizeof(simple_struct_t) * array_count;
result->pointer_array = (simple_struct_t *)malloc(size);
if (result->pointer_array == NULL) {
free(result);
return NULL;
}
memset(result->pointer_array, 0, size);
result->pointer_array_count = array_count;
return result;
}
void
free_complex_struct(complex_struct_t *cs)
{
free(cs->pointer_array);
free(cs);
}
static inline void
print_simple_struct(simple_struct_t *ss)
{
printf(“int %d long %ld float %f\n”, ss->int_var, ss->long_var, ss->float_var);
}
void
print_complex_struct(complex_struct_t *cs)
{
int i;
printf(“String = %s\n”, cs->string);
printf(“Embedded : “);
print_simple_struct(&cs->embedded);
printf(“External : \n”);
for (i=0; i
printf(“%d) “, i + 1);
print_simple_struct(&cs->pointer_array[i]);
}
}
[/c]
[raw tab=’interface’]
// test_swig.i
%module test_struct
%{
#include “../test.h”
%}
%include “test.h”
[/raw]
[shell tab=’commands’]
# Commands to make the shared library
$ mkdir -p _build
$ gcc -I /usr/include/python2.7/ -fPIC -c -o _build/test.o test.c
$ swig -python -outdir _build -o _build/test_swig_wrap.c test_swig.i
$ gcc -I /usr/include/python2.7/ -fPIC -c -o _build/test_swig_wrap.o _build/test_swig_wrap.c
$ ld -shared _build/test.o _build/test_swig_wrap.o -o _build/_test_struct.so
$ rm _build/test_swig_wrap.c
[/shell]
[raw tab=’makefile’]
#Makefile
BLD_DIRECTORY = _build
SWIG_SRCS = test_swig.i
C_SRCS = test.c
CFLAGS = -I /usr/include/python2.7/ -fPIC -c -Wall
OBJS = $(patsubst %.c, $(BLD_DIRECTORY)/%.o, $(C_SRCS)) \
$(patsubst %.i, $(BLD_DIRECTORY)/%_wrap.o, $(SWIG_SRCS))
$(BLD_DIRECTORY)/%.o: %.c %.h
gcc $(CFLAGS) -o $@ $<
$(BLD_DIRECTORY)/%.o: $(BLD_DIRECTORY)/%.c
gcc $(CFLAGS) -o $@ $<
$(BLD_DIRECTORY)/%_wrap.c: %.i
swig -python -outdir $(BLD_DIRECTORY) -o $@ $<
cp $@ $@.bak
$(BLD_DIRECTORY):
mkdir -p $(BLD_DIRECTORY)
clean:
rm -rf $(BLD_DIRECTORY)
all: $(BLD_DIRECTORY) $(OBJS) $(C_SRCS) $(SWIG_SRCS)
ld -shared $(OBJS) -o $(BLD_DIRECTORY)/_test_struct.so
.PHONY: all clean
.DEFAULT_GOAL := all
[/raw]
[/codegroup]
With this simple interface file, SWIG would be able to create a _test_struct.so and test_struct.py which is perfect for most cases.
[raw tab=’interface’]
%module test_struct
%{
#include “../test.h”
%}
%include “test.h”
[/raw]
[python]
import test_struct as ts
cs = ts.alloc_complex_struct(1)
cs.string = “Hello”
cs.embedded.int_var = 9
cs.embedded.long_var = 10
cs.embedded.float_var = 11.23
ts.print_complex_struct(cs)
ts.free_complex_struct(cs)
[/python]
This shows SWIG’s ability to convert C string to python string and vice versa.
Similarly accessing primitive structure members is very easy.
Here is the output of the program when ran from _build directory.
[raw]
String = Hello
Embedded : int 9 long 10 float 11.230000
Pointer Array :
1) int 0 long 0 float 0.000000
[/raw]
It also shows how to call function call into C library. If you have noticed this program looks more like a C program rather than a python program – mainly because it manages the memory allocation/free. Python can informed that [c] alloc_complex_struct() [/c] returns a new object and it is the responsibility of the caller to free it by using the SWIG typemap [python] newobject [/python]. Now python garbage collector will free the object when there is no reference. But python does not know how to free the object(complex_struct_t) – this can be done by using [python]newfree[/python] typemap.
By adding the following to the test_swig.i, we can avoid calling free_complex_struct() in python program.
[c]
%typemap(newobject) alloc_complex_struct;
%typemap(newfree) complex_struct_t * {
free_complex_struct($1);
}
[/c]
Lets modify the program a little bit and access the pointer_array elements.
[python]
import test_struct as ts
cs = ts.alloc_complex_struct(5)
print ‘Pointer array count ‘, cs.pointer_array_count
print cs.pointer_array[0]
ts.free_complex_struct(cs)
[/python]
This will fail with the following error:
[raw]
Pointer array count 5
Traceback (most recent call last):
File “./test.py”, line 4, in
print cs.pointer_array[0]
TypeError: ‘simple_struct_t’ object does not support indexing
[/raw]
The reason is SWIG does not really know [c]simple_struct_t *pointer_array;[/c] actually points to an array of [c]simple_struct_t[/c]. In other words SWIG safely assumes it points to a single entry. If pointer_array was “array of simple_struct_t pointers” then carrays.i macro would have been helped. But pointer_array is actually “pointer to array of simple_struct_t” so carrays.i won’t help.
The easiest way is extending complex_struct_t and add a new member(kind of) function to it.
[c]
%extend complex_struct_t{
simple_struct_t *get_array_element(int i) {
return &$self->pointer_array[i];
}
}
[/c]
This way cs.get_array_element(4) will return 4th element in the array.
Similarly tlv elements can be accessed also – but this time I decided to override indexing operator([]).
[c]
%extend complex_struct_t{
unsigned char __getitem__(int i) {
return $self->tlv[i];
}
}
[/c]
However this is not useful since python cant cast from [c](struct tlv_base *)[/c] to [c]struct tlv_type1 *[/c]. To cast, a C function can be coded or SWIG’s cpointer.i can be used.
Here is the full test_swig.i
[c]
%module test_struct
%{
#include “../test.h”
%}
%include “test.h”
%extend complex_struct{
simple_struct_t *get_array_element(int i) {
return &$self->pointer_array[i];
}
}
%typemap(newobject) alloc_complex_struct;
%typemap(newfree) complex_struct_t * {
free_complex_struct($1);
}
%include
%pointer_cast(tlv_base_t *, tlv_type1_t *, cast_to_tlv_type1);
[/c]
And test code:
[python]
import test_struct as ts
cs = ts.alloc_complex_struct(5)
cs.string = ‘Hello’
print ‘Pointer array count ‘, cs.pointer_array_count
for i in range(cs.pointer_array_count):
simple_struct = cs.get_array_element(i)
simple_struct.int_var = i * 10
simple_struct.long_var = i * 20
simple_struct.float_var = i * 3.3
ts.print_complex_struct(cs)
tlv = ts.cast_to_tlv_type1(cs.tlv)
print tlv.stat, tlv.info, tlv.something
[/python]
LLDB Backtrace formatting
lldb can be configured to print backtraces with syntax highlighting. Here is how to setup lldb to do that
Consider the following source level debugging session,
[codegroup]
[c tab=’source’]
$ cat test.c
static void crash_me()
{
char *c = 0;
*c = 0;
}
static void recursive_call(int value)
{
if (value == 0) {
crash_me();
}
recursive_call(value – 1);
}
int main(int argc, char argv[])
{
recursive_call(argc);
}
[/c]
[shell tab=’commands’]
$ gcc -g3 -O3 test.c
$ lldb a.out
(lldb) run 0 1 2 3 4 5
[/shell]
[/codegroup]
Without color syntax the backtrace would look like the following.

Normal backtrace with out any makeup
Since lldb supports ANSI escape sequence, the escape sequences can be used to color the backtrace output which makes output more readable. Here is the link to official lldb page describing this feature – http://lldb.llvm.org/formats.html.
Here is my backtrace setting and example
[shell]
(lldb) settings set frame-format “frame #${frame.index}: ${frame.pc}{ \x1b\x5b36m${module.file.basename}\x1b\x5b39m{` \x1b\x5b33m${function.name-with-args} \x1b\x5b39m${function.pc-offset}}}{ at ${line.file.basename}:${line.number}}\n”
[/shell]

Backtrace with color
Similarly thread format cant be colorized so that ‘thread list‘ would look neat.
[shell]
(lldb) settings set thread-format “\x1b\x5b42;1mthread #${thread.index}: tid = ${thread.id}{, ${frame.pc}}{ \x1b\x5b31m${module.file.basename}\x1b\x5b39m{`${function.name-with-args}${function.pc-offset}}}{ at ${line.file.basename}:${line.number}}{, name = ‘\x1b\x5b34m${thread.name}}\x1b\x5b39m{, queue = ‘${thread.queue}}{, stop reason = ${thread.stop-reason}}{\nReturn value: ${thread.return-value}}\x1b\x5b0m\n”
[/shell]
Reference to ANSI escape sequence – http://ascii-table.com/ansi-escape-sequences.php
Internals of GNU Code Coverage – gcov
Few years ago I worked on a small project to extract code coverage information created by gcc from FreeBSD based kernel. During that time I didn’t find any good internal documentation about gcov. So here I post what I learned. Before jumping to the internals of GCOV here is an example from the man page.
$ gcov -b tmp.c
87.50% of 8 source lines executed in file tmp.c
80.00% of 5 branches executed in file tmp.c
80.00% of 5 branches taken  at  least  once  in  file tmp.c
50.00% of 2 calls executed in file tmp.c
Creating tmp.c.gcov.
Here is a sample of a resulting tmp.c.gcov file:

      main()
      {
    1        int i, total;
    1        total = 0;
   11        for (i = 0; i < 10; i++)
branch 0 taken = 91%
branch 1 taken = 100%
branch 2 taken = 100%
   10        total += i;
   1         if (total != 45)
branch 0 taken = 100%
  ######          printf ("Failure0);
call 0 never executed
branch 1 never executed
             else
    1             printf ("Success0);
call 0 returns = 100%
    1    }
Note – gcov has a cool graphical front-end in Linux – lcov.
As shown above gcov can show what all code path executed and how many time executed.
Want to try? Here is the quick example.
[shell]
$ gcc -fprofile-arcs -ftest-coverage your_program.c
$ ./a.out
$ gcov your_program.c
[/shell]
During compilation with -ftest-coverage option gcc generates a “.gcno” file. It contains information about each branches in your code. While finishing execution, ./a.out creates .gcda file(s) which actually contains which all branches taken(basic block entry/exit). Using these there files .c(source), .gcno(block info) and .gcda(block execution count) gcov command prints the code coverage information in a human readable format.
You might wonder how your ./a.out would create .gcda while exiting the program. It is because of “-fprofile-arcs” automatically includes libgcov. Libgcov registers itself to be invoked during program exit by using atexit(). (Yes – it wont generate .gcda files if you exit abnormally). And during program exit it just dumps all the branch information to one or more gcda file.
The coverage information is “just” dumped into files by libgcov. So who collects the the coverage information at run time? Actually the program itself collects the coverage information. In-fact only it can collect because only it knew which all code path it takes. The code coverage information is collected at run-time on the fly. It is accomplished by having a counter for each branch. For example consider the following program.
int if_counter = 0, else_counter = 0;

void dump_counters()
{
	int fd;

	fd = open(strcat(filename, ".gcda"), "w");
	write(fd, if_counter, sizeof(if_counter));
	write(fd, else_counter, sizeof(else_counter));
}

int main(int argc, char *argv[])
{
	atexit(dump_counters);

	if(argc > 1) {
		if_counter++;
		printf("Arguments provided\n");
	} else {
		else_counter++;
		printf("No arguments\n");
	}
}
If you replace the above example with gcov then green colored code is provided by libgcov(during link/load) and the blue colored coded inserted into your executable by gcc(during compilation).
It is easy to speculate how the increment operation would be be implanted inside your code by gcc. gcc just inserts “inc x-counter“ machine instruction before and after every branch. It should be noted that “inc” is instruction might have side effect on some programs which uses asm inside C. For example in x86 the “inc” instruction affects carry flag. Some assembly code might depends on this and if gcc inserts “inc counter” instruction then it will result in error. I had hard time figuring this out when compiled with -fprofile-arcs a kernel was booting but not able to receive any network packets(it was discarding all packets because the network stack found the checksum was wrong).
Here is a simple C program’s disassembly:
[codegroup]
[c tab=’disassembly’]
int main()
{
4004b4: 55 push %rbp
4004b5: 48 89 e5 mov %rsp,%rbp
int a = 1;
4004b8: c7 45 fc 01 00 00 00 movl $0x1,-0x4(%rbp)
if (a) {
4004bf: 83 7d fc 00 cmpl $0x0,-0x4(%rbp)
4004c3: 74 06 je 4004cb
a++;
4004c5: 83 45 fc 01 addl $0x1,-0x4(%rbp)
4004c9: eb 04 jmp 4004cf
} else {
a–;
4004cb: 83 6d fc 01 subl $0x1,-0x4(%rbp)
}
return a;
4004cf: 8b 45 fc mov -0x4(%rbp),%eax
}
[/c]
[c tab=’source’]
int main()
{
int a = 1;
if (a) {
a++;
} else {
a–;
}
return a;
}
[/c]
[shell tab=’command’]
gcc -g3 test.c
objdump -S -d ./a.out
[/shell]
[/codegroup]
When the same program compiled with profile-arcs, the disassembly looks like
int main()
{
  400c34:       55                      push   %rbp
  400c35:       48 89 e5                mov    %rsp,%rbp
  400c38:       48 83 ec 10             sub    $0x10,%rsp
    int a = 1;
  400c3c:       c7 45 fc 01 00 00 00    movl   $0x1,-0x4(%rbp)

    if (a) {
  400c43:       83 7d fc 00             cmpl   $0x0,-0x4(%rbp)
  400c47:       74 18                   je     400c61
        a++;
  400c49:       83 45 fc 01             addl   $0x1,-0x4(%rbp)
  400c4d:       48 8b 05 3c 25 20 00    mov    0x20253c(%rip),%rax        # 603190
  400c54:       48 83 c0 01             add    $0x1,%rax
  400c58:       48 89 05 31 25 20 00    mov    %rax,0x202531(%rip)        # 603190
  400c5f:       eb 16                   jmp    400c77
    } else {
        a--;
  400c61:       83 6d fc 01             subl   $0x1,-0x4(%rbp)
  400c65:       48 8b 05 2c 25 20 00    mov    0x20252c(%rip),%rax        # 603198
  400c6c:       48 83 c0 01             add    $0x1,%rax
  400c70:       48 89 05 21 25 20 00    mov    %rax,0x202521(%rip)        # 603198
    }

    return a;
  400c77:       8b 45 fc                mov    -0x4(%rbp),%eax
}
  400c7a:       c9                      leaveq
  400c7b:       c3                      retq
From the above disassembly it might seem putting inc instruction while compiling is easy. But how/where storage for the counters(dtor_idx.6460 and dtor_idx.6460 in above example) are created. GCC uses statically allocated memory. Dynamically allocating space is one way but it would complicate the code(memory allocation operations during init) and might slow down execution of program(defer pointer). To avoid that gcc allocates storage as a loadable section.
The compiler keep tracks of all the counters in a single file. The data structure outlined in the below picture.
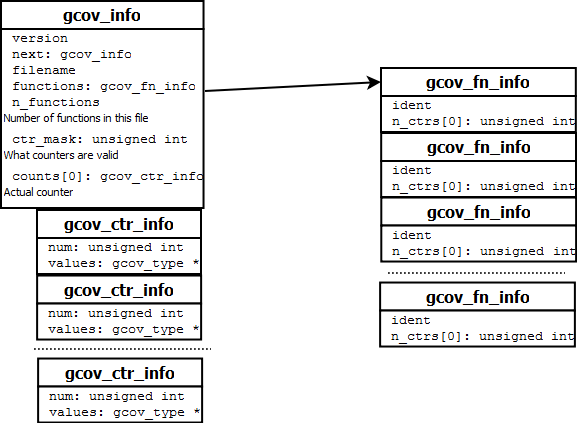
There is a single gcov_info structure for a C file. And multiple gcov_fn_info and gcov_ctr_info. During program exit() these structures are dumped into the .gcda file. For a project(with multiple C files) each C file will have a gcov_info structure. These gcov_info structures should be linked together so that during exit() the program can generate .gcda file for all the C files. This is done by using constructors and destructors.
Generic C constructor:
gcc generates constructors for all program. C constructors are accomplished by using “.ctors” section of ELF file. This section contains array of function pointers. This array is iterated and each function is invoked by _init()->__do_global_ctors_aux() during program start. _init() is placed “.init” section so it will be called during program initialization. A function can be declared as constructor by using function attribute.
“-ftest-coverage” creates a constructor per file. This constructor calls __gcov_init() and passes the gcov_info as argument.
samuel@ubuntu:~$objdump  -t ./a.out  | grep -i _GLOBAL__
0000000000400c7c l     F .text  0000000000000010              _GLOBAL__sub_I_65535_0_main
And disassembly of _GLOBAL__sub_I_65535_0_main
 954 0000000000400c7c <_global__sub_i_65535_0_main>:
 955   400c7c:       55                      push   %rbp
 956   400c7d:       48 89 e5                mov    %rsp,%rbp
 957   400c80:       bf 00 31 60 00          mov    $0x603100,%edi
 958   400c85:       e8 a6 12 00 00          callq  401f30 <__gcov_init>
 959   400c8a:       5d                      pop    %rbp
 960   400c8b:       c3                      retq
 961   400c8c:       90                      nop
 962   400c8d:       90                      nop
 963   400c8e:       90                      nop
 964   400c8f:       90                      nop
gcov_init() implemented in libgcov stores all the gcov_info() passed in a linked list. This linked list is used to walk through all the gcov_info during program termination.
Plot your data using gnuplot
System statistics are hard interpolate since usually they are collected in large quantities and sometimes represents large numbers. Recently I was doing a prototype and wanted to measure how much damage it would to the main project (in terms of performance); so used performance counter feature in the processor to measure some events(cache miss, memory read etc) with and without my code change. But after looking at the numbers I realized it is difficult to analyze such a data. Because each number is 8 digit and I had 16 columns(16 cpu) and 100 rows of data(100 seconds of run). So I decided to use some graph so that it would be easy to understand the data.
Googled for a GNU graph tool and found gnu plot – this blog is to show how good it is and how easy it is to use. Consider using it if you have lot of numbers. For this post I took some sample data from my ubuntu machine while running stress command.
[codegroup]
[shell tab=’output’]
cat stat.txt
procs ———–memory———- —swap– —–io—- -system– —-cpu—-
r b swpd free buff cache si so bi bo in cs us sy id wa
0 0 251124 1827388 4720 32704 6 34 19 38 42 74 1 0 98 1
0 0 251124 1827388 4720 32708 0 0 0 0 104 71 0 0 100 0
13 3 251108 1349912 4728 322540 4 0 4 20 683 1789 42 12 47 0
11 3 251008 1382620 4728 322520 180 0 180 0 1604 1233 89 12 0 0
11 3 251008 1432052 4728 322520 0 0 0 0 1361 1237 90 10 0 0
11 3 251008 1298352 4728 322668 0 0 0 0 1392 1275 90 10 0 0
2 3 251008 1512576 4728 323524 0 0 0 0 20077 14827 59 16 13 12
0 0 251008 1826388 4728 32756 0 0 0 0 45069 25566 0 4 25 71
0 0 251008 1826444 4728 32708 0 0 0 0 59 46 0 0 100 0
…
[/shell]
[shell tab=’stress’]
stress –cpu 8 –io 4 –vm 2 –vm-bytes 128M –hdd 2 –timeout 200s
[/shell]
[shell tab=’vmstat’]
sudo vmstat -n 1 200 > stat.txt
[/shell]
[/codegroup]
The following example shows how to create line graph for us, sy columns in the above against time(seconds).
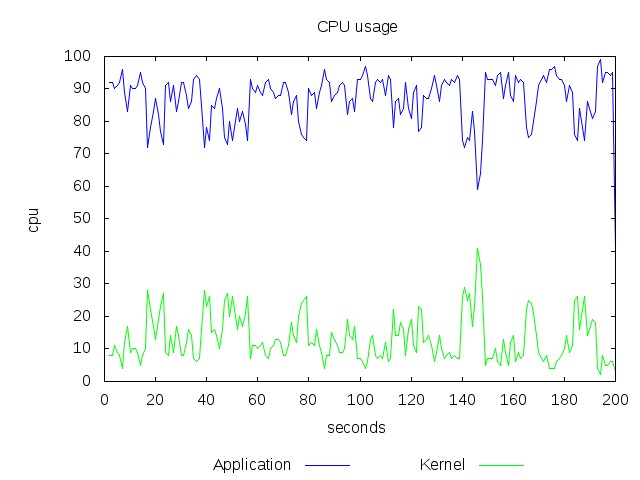
This graph might not be impressive because it deals with only numbers ranging from 0-100 and the numbers are very steady. Consider a range 0-99999999 and the numbers are fluctuating too much then it will be to graph. The above graph was created by running “gnuplot” with following commands
[shell]
set title ‘CPU usage’
#set terminal svg butt enhanced dynamic
set terminal jpeg
set output ‘output.jpg’
set xlabel ‘seconds’
#set logscale y
set ylabel ‘cpu’
set key below
plot \
“stat.txt” using :13 title ‘Application’ with lines lc rgb ‘blue’, \
“stat.txt” using :14 title ‘Kernel’ with lines lc rgb ‘green’
[/shell]
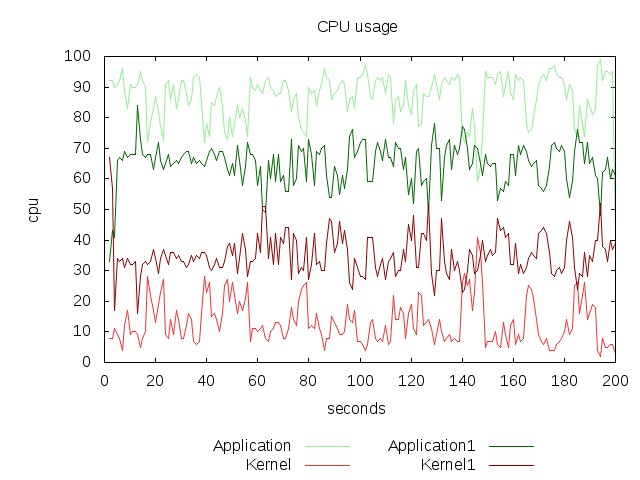
You can also intermix two or more data files. The following example shows how to graph two different samples collected during different time period.
[shell]
set title ‘CPU usage’
#set terminal svg butt enhanced dynamic
set terminal jpeg
set output ‘output.jpg’
set xlabel ‘seconds’
#set logscale y
set ylabel ‘cpu’
set key below
plot \
“stat.txt” using :13 title ‘Application’ with lines lc rgb ‘light-green’, \
“stat.txt” using :14 title ‘Kernel’ with lines lc rgb ‘light-red’, \
“stat1.txt” using :13 title ‘Application1’ with lines lc rgb ‘dark-green’, \
“stat1.txt” using :14 title ‘Kernel1’ with lines lc rgb ‘dark-red’
[/shell]
The stat1.txt file is generated by running vmstat while the system was stressed by the following command
[shell]stress –cpu 4 –io 2 –vm 4 –vm-bytes 1M –hdd 2 –hdd-bytes 4096 –timeout 200s[/shell]
The nice thing about gnuplot is it will skip the row(line) in the data file if it cant recognize the columns. And also it supports svg and pdf outputs. See what all gnuplot can do at the official demo page.
OpenOCD and NGX USB ARM JTAG
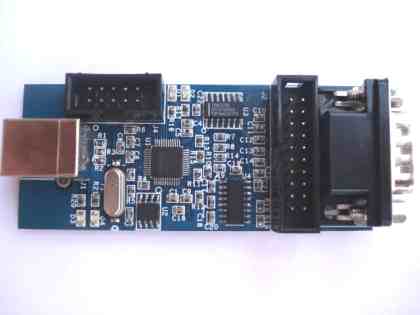
NGX’s USB ARM JTAG
This post describes the steps needed to make NGX’s USB ARM JTAG to work with OpenOCD in windows 7. This JTAG is compatible with colink JTAG and works with IAR Workbench and Keil uVision. To use with these IDEs there is a well defined methods/plug-ins available in the product page and in internet. However to use this JTAG with OpenOCD there is scarce resource in the internet.
OpenOCD can be used to low level debugging, source level debugging (through GDB) and can be used for flashing. OpenOCD exposes a command line interface which can be accessed through telnet. It also provides remote GDB server which also can be reached through TCP connection.
Steps needed for Windows:
- Plug-In the JTAG to a available USB connector
- Download libusb-win32
- Extract libusb-win32 to a folder and run “inf-wizard.exe”
- Select “USB Serial Converter A” and install driver
- Download and install OpenOCD
- Attach the JTAG probe to your target ARM board and poweron the target board
- Create a openocd configurations file (see at the end)
- Run openocd.exe –f
- Run putty or telnet and connect to port localhost:4444
After this the target board will respond to JTAG commands which can be issued through the telnet session.
For GDB debugging, you need a cross compiled GDB(arm-none-eabi-gdb).
After launching arm-none-eabi-gdb.exe run target remote localhost:3333 to start remote debugging.
You can execute low level JTAG commands from GDB by using monitor command.
Flashing can be done using the following commands:
[shell]
reset
halt
sleep 200
wait_halt
flash probe 0
flash info 0
flash write_image erase unlock
sleep 200
reset run
[/shell]
OpenOCD configuration file:
[shell]
# openocd configurations
telnet_port 4444
# gdb configuration
gdb_port 3333
# cpu configuration
source [find target/lpc1768.cfg]
# interface configuration
interface ft2232
ft2232_vid_pid 0x0403 0x6010
ft2232_device_desc “NGX JTAG”
ft2232_layout “oocdlink”
ft2232_latency 2
[/shell]
USB image creation using dd command
Wrote this post while waiting for a “dd” command to finish USB image creation. So this post is mainly for dd tips.
How to find where my usb drive is attached?
Attach USB and then issue the following command and then look for ‘/dev/sd??’
[shell]dmesg | less[/shell]
How to create a USB drive clone?
[shell]sudo dd if=/dev/xxx of=clone.img[/shell]
The output image will be in clone.img.
If you want to restore to the original disk or another USB drive then use
[shell]sudo dd of=/dev/xxx if=clone.img[/shell]
How long will it take for a X GB drive?
Depends on your usb drive transfer rate. But also depends on the buffer size used by dd, I use
[shell]sudo dd of=/dev/xxx if=clone.img bs=10M[/shell]
iostat will give you the transfer rate of your devices
Dont know whether dd is dead or not?
If you send USR1 signal to dd it will print the status.
[shell]sudo kill -USR1 `pidof dd`[/shell]
If you want auto update every 10 sec, try
[shell]watch -n 10 sudo kill -USR1 `pidof dd`[/shell]
Eva
Eva is an expression evaluator developed as a cross platform utility. It is written using ANTLR(targetting C), gcc. Eva supports all C expressions including bitwise operations. It is created to aid developers to convert between hexa to binary operations easily. The main goal was very simple code base ~1000 lines.
The UI part was initially coded using wxWidgets and now contains – simple command line interface, wxWidgets and Windows specific GUI interface. Here is a video demonstrating different operations possible with Eva.
http://www.youtube.com/watch?v=m7ieVDEkdZ4
Here is the source code – https://bitbucket.org/samueldotj/eva
Size of all data structures in a C program
There are some cases when you want to find size of all data structures in your program/project. For a given program it is easy because we can manually calculate or put a printf sizeof() to calculate a few structures. But for a project with few hundred files it is difficult. There is noway AFAIK in gcc to dump all the structure sizes while it compiles.
Here is a way todo it using DWARF debugging info if you are using gnu compiler tools. Compile your project output file with -g option, this will generate debugging information in your program. Then run objdump to dump the debug info. This debugging information contains all the information about your program, filter the output for “DW_TAG_structure_type” and you will get only structure information.
Here is how I did it:
[shell]
objdump -W kernel.debug.reloc > debug.info
grep -e “DW_TAG_structure_type” debug.info –after-context=5 –mmap > structs.txt
[/shell]
Call Trace without modifying the source
While investigating about gcc flag “-fprofile-arcs”, I came to know about a new(to me) gcc flag and this blog entry is about it. For any large C project it is hard to learn/find call graph through code walk. From C prospective unless otherwise you put a printf in each function entry/exit it is hard to find the call trace.
GCC and ICC has a wonderful option “-finstrument-functions” to solve this. This option instructs the compiler to emit instructions to call a external function on each function’s entry/exit. Defining these two functions like the following and adding the above option -finstrument-function to your makefile will do the magic.
[c]
void noinstrument __cyg_profile_func_enter(void *this_fn, void *call_site)
{
printf(“%p called from %p\n”, this_fn, call_site);
}
void noinstrument __cyg_profile_func_exit(void *this_fn, void *call_site)
{
printf(“%p returns\n”, this_fn);
}
[/c]
Of course, you can do anything in these functions, for simplicity sake I just defined them as printfs.
GCC debugging switches
While compiling a FreeBSD kernel I encountered the following error message from GNU assembler
[shell]
Error: suffix or operands invalid for ‘mov’
[/shell]
I was not sure whether the error is because of my changes are not. But still I have to debug the problem and solve it, so I decided to find what is wrong with the mov instruction. But since gcc created a temporary file and invoked as to assemble it, I couldn’t find the temp file anymore.
Googled and find the following gcc options to find what gcc does.
gcc –v is verbose mode, which prints all the action/scripts gcc is doing.
gcc -### similar to –v but wont execute any commands.
gcc –save-temps saves all the temporary files generated by the gcc. Useful if you want to see the assembly output passed to gnu assembler.
gcc –E Just preprocess the c file.
gcc –S generate assembly file.
With gcc –v –save-temps, I got the temporary assembler file used by assembler. Since reading machine generated assembly file is difficult, I tried to find the C source code corresponding to the error. From nearest .file assembler directive I found the C file name and from the .loc directive I found the line number. And the following was the inline assembly in the C file.
[c]__asm __volatile(“movl %%ss,%0″ : “=rm” (sel));[/c]
Was surprised what is wrong with this and why my assembler giving error. Googled again and found this link – http://kerneltrap.org/node/5785. It seems newer gnu assembler(>=2.16) wont support long read/write operations(mov) on segment registers(ds,ss…). So changed the above source to movw %%ss, %o and it compiled perfectly. 🙂