Archive for the ‘Debugger’ Category
LLDB Backtrace formatting
lldb can be configured to print backtraces with syntax highlighting. Here is how to setup lldb to do that
Consider the following source level debugging session,
[codegroup]
[c tab=’source’]
$ cat test.c
static void crash_me()
{
char *c = 0;
*c = 0;
}
static void recursive_call(int value)
{
if (value == 0) {
crash_me();
}
recursive_call(value – 1);
}
int main(int argc, char argv[])
{
recursive_call(argc);
}
[/c]
[shell tab=’commands’]
$ gcc -g3 -O3 test.c
$ lldb a.out
(lldb) run 0 1 2 3 4 5
[/shell]
[/codegroup]
Without color syntax the backtrace would look like the following.

Normal backtrace with out any makeup
Since lldb supports ANSI escape sequence, the escape sequences can be used to color the backtrace output which makes output more readable. Here is the link to official lldb page describing this feature – http://lldb.llvm.org/formats.html.
Here is my backtrace setting and example
[shell]
(lldb) settings set frame-format “frame #${frame.index}: ${frame.pc}{ \x1b\x5b36m${module.file.basename}\x1b\x5b39m{` \x1b\x5b33m${function.name-with-args} \x1b\x5b39m${function.pc-offset}}}{ at ${line.file.basename}:${line.number}}\n”
[/shell]

Backtrace with color
Similarly thread format cant be colorized so that ‘thread list‘ would look neat.
[shell]
(lldb) settings set thread-format “\x1b\x5b42;1mthread #${thread.index}: tid = ${thread.id}{, ${frame.pc}}{ \x1b\x5b31m${module.file.basename}\x1b\x5b39m{`${function.name-with-args}${function.pc-offset}}}{ at ${line.file.basename}:${line.number}}{, name = ‘\x1b\x5b34m${thread.name}}\x1b\x5b39m{, queue = ‘${thread.queue}}{, stop reason = ${thread.stop-reason}}{\nReturn value: ${thread.return-value}}\x1b\x5b0m\n”
[/shell]
Reference to ANSI escape sequence – http://ascii-table.com/ansi-escape-sequences.php
OpenOCD and NGX USB ARM JTAG
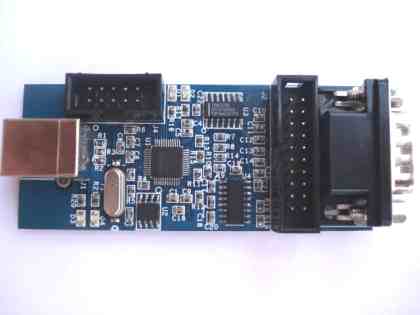
NGX’s USB ARM JTAG
This post describes the steps needed to make NGX’s USB ARM JTAG to work with OpenOCD in windows 7. This JTAG is compatible with colink JTAG and works with IAR Workbench and Keil uVision. To use with these IDEs there is a well defined methods/plug-ins available in the product page and in internet. However to use this JTAG with OpenOCD there is scarce resource in the internet.
OpenOCD can be used to low level debugging, source level debugging (through GDB) and can be used for flashing. OpenOCD exposes a command line interface which can be accessed through telnet. It also provides remote GDB server which also can be reached through TCP connection.
Steps needed for Windows:
- Plug-In the JTAG to a available USB connector
- Download libusb-win32
- Extract libusb-win32 to a folder and run “inf-wizard.exe”
- Select “USB Serial Converter A” and install driver
- Download and install OpenOCD
- Attach the JTAG probe to your target ARM board and poweron the target board
- Create a openocd configurations file (see at the end)
- Run openocd.exe –f
- Run putty or telnet and connect to port localhost:4444
After this the target board will respond to JTAG commands which can be issued through the telnet session.
For GDB debugging, you need a cross compiled GDB(arm-none-eabi-gdb).
After launching arm-none-eabi-gdb.exe run target remote localhost:3333 to start remote debugging.
You can execute low level JTAG commands from GDB by using monitor command.
Flashing can be done using the following commands:
[shell]
reset
halt
sleep 200
wait_halt
flash probe 0
flash info 0
flash write_image erase unlock
sleep 200
reset run
[/shell]
OpenOCD configuration file:
[shell]
# openocd configurations
telnet_port 4444
# gdb configuration
gdb_port 3333
# cpu configuration
source [find target/lpc1768.cfg]
# interface configuration
interface ft2232
ft2232_vid_pid 0x0403 0x6010
ft2232_device_desc “NGX JTAG”
ft2232_layout “oocdlink”
ft2232_latency 2
[/shell]
Size of all data structures in a C program
There are some cases when you want to find size of all data structures in your program/project. For a given program it is easy because we can manually calculate or put a printf sizeof() to calculate a few structures. But for a project with few hundred files it is difficult. There is noway AFAIK in gcc to dump all the structure sizes while it compiles.
Here is a way todo it using DWARF debugging info if you are using gnu compiler tools. Compile your project output file with -g option, this will generate debugging information in your program. Then run objdump to dump the debug info. This debugging information contains all the information about your program, filter the output for “DW_TAG_structure_type” and you will get only structure information.
Here is how I did it:
[shell]
objdump -W kernel.debug.reloc > debug.info
grep -e “DW_TAG_structure_type” debug.info –after-context=5 –mmap > structs.txt
[/shell]